The carry trade at a retail broker: what's left after the swap
Here is an idea that sounds almost too reasonable for the forex market. Some countries pay high interest rates, others pay almost nothing. So borrow the cheap currency, hold the expensive one, and collect the difference every night, whether the price moves or not. Hedge funds have run it for decades. It even has a calm, sensible name: the carry trade.
A retail trader can do it too, with a few clicks. But at a retail broker the nightly interest does not arrive in full. We took the textbook carry trade, ran it on eight major currencies for fifteen years, and asked a simple question: after the broker's cut, what is left?
How the trade is supposed to pay
Every currency has an interest rate set by its central bank, the policy rate. When you buy a currency pair such as AUD/JPY at a broker, you are in effect holding Australian dollars and owing Japanese yen. If Australia's rate is 4% and Japan's is close to 0%, you earn roughly the 4% difference a year for as long as you hold the position. Hold the pair the other way round, and you pay it.
At a retail broker this nightly interest is called swap (or rollover). It is added to or taken from your account every night a position stays open. Positive swap is the carry trade's whole point.
The catch everyone mentions is that the price can move against you faster than the interest comes in. The catch fewer people mention is the swap markup: brokers do not pass the interest gap on at the wholesale rate. They pay you a bit less when you earn it, charge you a bit more when you owe it, and keep the difference.
Why it has such a good reputation
- It is real money, paid daily. Carry needs no forecast. The interest is a known number before you open the trade.
- The research is serious. Academics have studied carry for decades.
- The 2022-2024 rate gap. When the US, UK and Australia raised rates fast and Japan and Switzerland did not, the gaps grew wide again, and carry was back on every forum.
The test, in plain words
- Eight currencies: the US dollar, euro, British pound, Japanese yen, Swiss franc, Canadian dollar, Australian dollar and New Zealand dollar.
- The rule, straight from the textbook: at the end of each month, rank the eight by their central bank's policy rate. Hold the three with the highest rates and be short (owe) the three with the lowest, in equal amounts. Keep it for a month, then rank again.
- What a month earns: the change in the exchange rates plus the interest gap for that month, which is what swap would pay at a fair price.
- Period: November 2011 to September 2026, 179 months, with daily policy rates from the Bank for International Settlements (BIS).
- Two cost levels:
- Low, professional-style costs: 0.02% of every change in position size, about a 2-pip round trip on EUR/USD (a pip is the smallest usual price step).
- Retail: the same, plus a swap markup of 1% a year on every open position. That number is our assumption; it varies by broker and by pair.
- A held-back test: results are reported for 2011-2020 and separately for 2021-2026. Nothing was fitted, since the rule is the textbook default, so the split is a stability check.
- How we score it: return per unit of risk, also called the Sharpe ratio: the yearly return divided by how much the account swings in a typical year. 0 means no reward for the risk taken. We also give a standard score of how far a result is from pure chance (the t-statistic): 0 is nothing, about 2 or more is what researchers call "significant". Our guide to backtesting explains why each check matters.
Fifteen years in one line
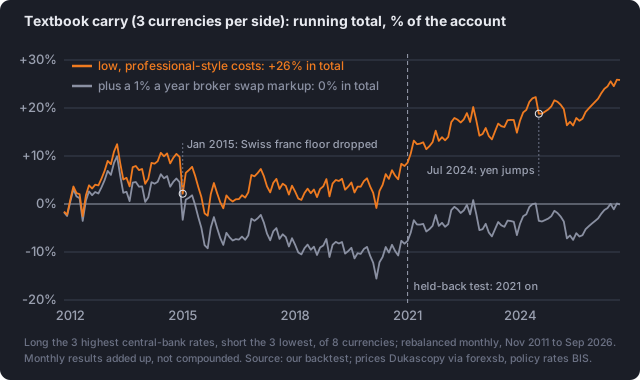
Source: our backtest on hourly prices from Dukascopy (via forexsb) and BIS policy rates. Monthly results added up, not compounded, in % of the starting account.
How to read it: orange is the trade at low, professional-style costs; grey is the same trades minus the 1% a year swap markup. The dashed line marks the start of the held-back period.
At professional costs the textbook trade made money, slowly. About +1.7% a year, +26% in total over the 179 months, with a return per unit of risk of 0.27. The chance score was about 1, so luck can't be ruled out.
After the swap markup, it made nothing. The retail version averaged −0.01% a year, a return per unit of risk of 0.00. The markup is charged on every open position, and the textbook trade holds six of them, adding up to between 1.7 and 2 times the account. At 1% a year on that much, the bill came to almost exactly what the strategy earned. Without that income to cushion the bad months, the drawdown (the deepest fall from a previous high) also grew, from −14.9% to −25.5%.
And it depends a lot on when you look. In 2011-2020 the score was 0.12: barely anything, because most central banks kept rates near zero for years, so there was little gap to collect. From 2021 on, as the gaps reopened, it was 0.63, and even the retail version kept a modest 0.29. So carry did not stop working. For a decade there was simply almost nothing to carry.
Two dates on the chart show the other side of the trade. In January 2015 Switzerland's central bank stopped holding the franc down against the euro, and the franc jumped in minutes. In July 2024 the yen rose sharply as traders who had borrowed it rushed out at once (a "carry unwind"). Sudden losses out of a calm market, each worth months of interest.
Can a smarter version keep more?
We tried 24 versions: holding the top and bottom 1, 2, 3 or 4 currencies, each with no filter or one of five "crash filters" meant to step aside before the big losses. They shrank the position when markets got wild, stepped aside after a jump in recent swings or a losing three months, or dropped currencies trending against the trade. All of them used only information available at the time.
No filter helped at any size. Each one lowered the return per unit of risk, and the trend filters often turned it negative. The worst months, such as May 2012 (the euro crisis), January 2015 and July 2024, were sudden shocks out of calm markets. Recent swings and trends gave no warning, while the filters did make the strategy sit out the ordinary recoveries.
Two currencies per side did best. Its return per unit of risk was 0.46, almost the same in both periods (0.45 before 2021, 0.49 after), with a drawdown of −13.6%. It was also the only size that kept something after the 1% swap markup: 0.25.
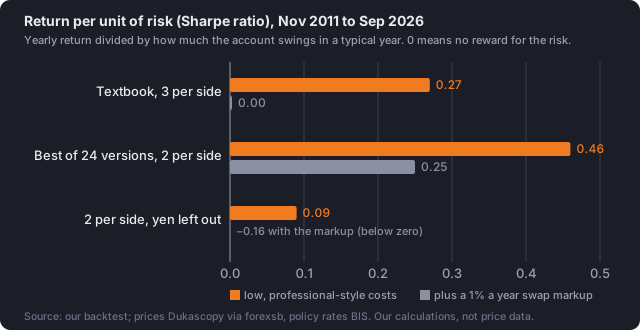
Source: our backtest on hourly prices from Dukascopy (via forexsb) and BIS policy rates, November 2011 to September 2026.
How to read it: orange is at low costs, grey includes the 1% swap markup. Longer bars paid more for the risk taken.
Before calling that a result, two warnings. First, it is the best of 24 versions, and the best of many always looks better than it really is; its chance score was 1.76, still short of 2. Second, look at the bottom bar.
Fifteen years of carry, one trade underneath
The two-per-side version did survive changes to the mechanics: rebalancing weekly or quarterly, or trading up to five days late, kept the score between 0.44 and 0.51. Then we looked at where the money came from. Of the roughly +56 percentage points it earned over the whole period, +52.7 came from one position: being short the Japanese yen. The strategy was short the yen in 158 of the 179 months, because Japan kept its rates at about zero while almost everyone else did not. And the yen fell for years: after Japan's big money-printing programme from 2012, then through the 2022-2024 rate gap.
Take the yen out of the eight currencies, and the score drops from 0.46 to 0.09, and to −0.19 since 2021. Taking out the Swiss franc instead, the other low-rate currency, barely matters (0.40). So in this sample, "carry with two currencies per side" was not a broad reward for holding high-interest currencies. It was a bet against the yen with some noise around it. The July 2024 unwind, a −5.5% month for this version, is what that bet looks like when it turns.
What a retail trader keeps
The textbook carry trade earned about 1.7% a year at professional costs, and nothing once a 1% a year swap markup was taken off. The best version kept a little after the markup, but almost all of its profit came from being short a falling yen. Whether that repeats is a question about Japan, not about carry.
So we call it weak, not dead. The interest gap is real money, and it has come back since rates rose in 2022. In the same study, carry was the only one of five classic currency strategies to make money after costs (the other four were momentum strategies, which buy what rose recently, and a mix of both styles). But the edge is thin, and it can quietly end up in a broker's swap table.
What would make carry worth a second look
- A cheaper swap. The markup decides almost everything here. A swap close to the central banks' rate gap leaves you nearer the orange line than the grey one. Check your broker's swap table before you check any chart.
- Wide interest gaps. Carry earned almost nothing while rates sat near zero. Without a meaningful gap, there is nothing to collect.
- Knowing what you really hold. If most of the profit comes from one currency, the trade is a bet on that currency.
- Sizing for the crash. No filter dodged the shocks, so a −6% to −8% month, like May 2012 or January 2015, has to be survivable.
The fine print
- Policy rates are a stand-in for the short-term interest gap a broker's swap is really based on. Close, but not identical.
- Only eight currencies. The Norwegian krone and Swedish krona are not in our price data. A broader basket could depend less on one currency.
- 179 months is not a lot, and the big shocks come a few times a decade. No result here clears the usual bar for "significant".
Everything behind this article, including the rules, the code and every monthly result, is in the study files.
Educational content, not financial advice.